Meta
Five Slides on Meta
The same chart, told five ways. Click through to see what the "+1% YoY" press line actually hides.
Source: LinkedIn TI · per-function monthly data · 2026-05-14
How the Functions Actually Moved
Real 13-month trajectories for each of Meta's top 10 functions. Engineering grew +2,193 while HR collapsed -33%and Marketing/Arts cut hard. The "+1% YoY" total hides a radical reshuffle underneath.
Source: LinkedIn TI · captured per-function via filter API · 13 months, all 10 top functions · 2026-05-14
The Skill Stack
Top 10 skills on Meta employee profiles. Bubbles pulse to that month's real count. Machine Learning keeps climbing through the year while older languages plateau.
Source: LinkedIn TI · monthly skill counts via per-skill filter · 2026-05-14
Skill Cloud · The 50 Skills That Define Meta
Size = headcount with that skill, color = growth direction. Purple is fastest-growing (AI/ML cluster). Red is shrinking. The cloud is built with d3-cloud — collision packed with rotation.
Source: LinkedIn TI · top 50 skills · 2026-05-14
Meta's Title Map
Top 10 titles, each a bubble. Sizes pulse to that month's real headcount. Watch ML Engineer and Production Engineer keep climbing while management roles ease back.
Source: LinkedIn TI · monthly headcount per title via filter · 2026-05-14
Meta on the Map
Top 10 metros plotted on a real geographic projection. Circle area = headcount, outline = growth direction. Greater Augusta, Bengaluru, and Taipei are the fastest-growing metros, marked in yellow.
Source: LinkedIn TI · world TopoJSON via world-atlas · 2026-05-14
The Extruded Map · Headcount as 3D Bars
The world as a slowly rotating plane, with a 3D bar rising from each Meta metro. Bar height = headcount, color = growth. Drag to rotate, scroll to zoom. SF towers over everything; East Coast and London hold the line.
Source: LinkedIn TI · top 10 metros · world TopoJSON · 2026-05-14
Meta's World, In Three Dimensions
The top 10 metros as pins on a slowly rotating globe. Pin height = headcount, color = growth direction. Drag to rotate; scroll to zoom; hover for details. Powered by three.js + react-three-fiber.
Source: LinkedIn TI · top 10 metros · drag to rotate · scroll to zoom · 2026-05-14
Meta's World, By Headcount
inspired by · Visual Capitalist + voronoiapp · Agricultural Land voronoi ↗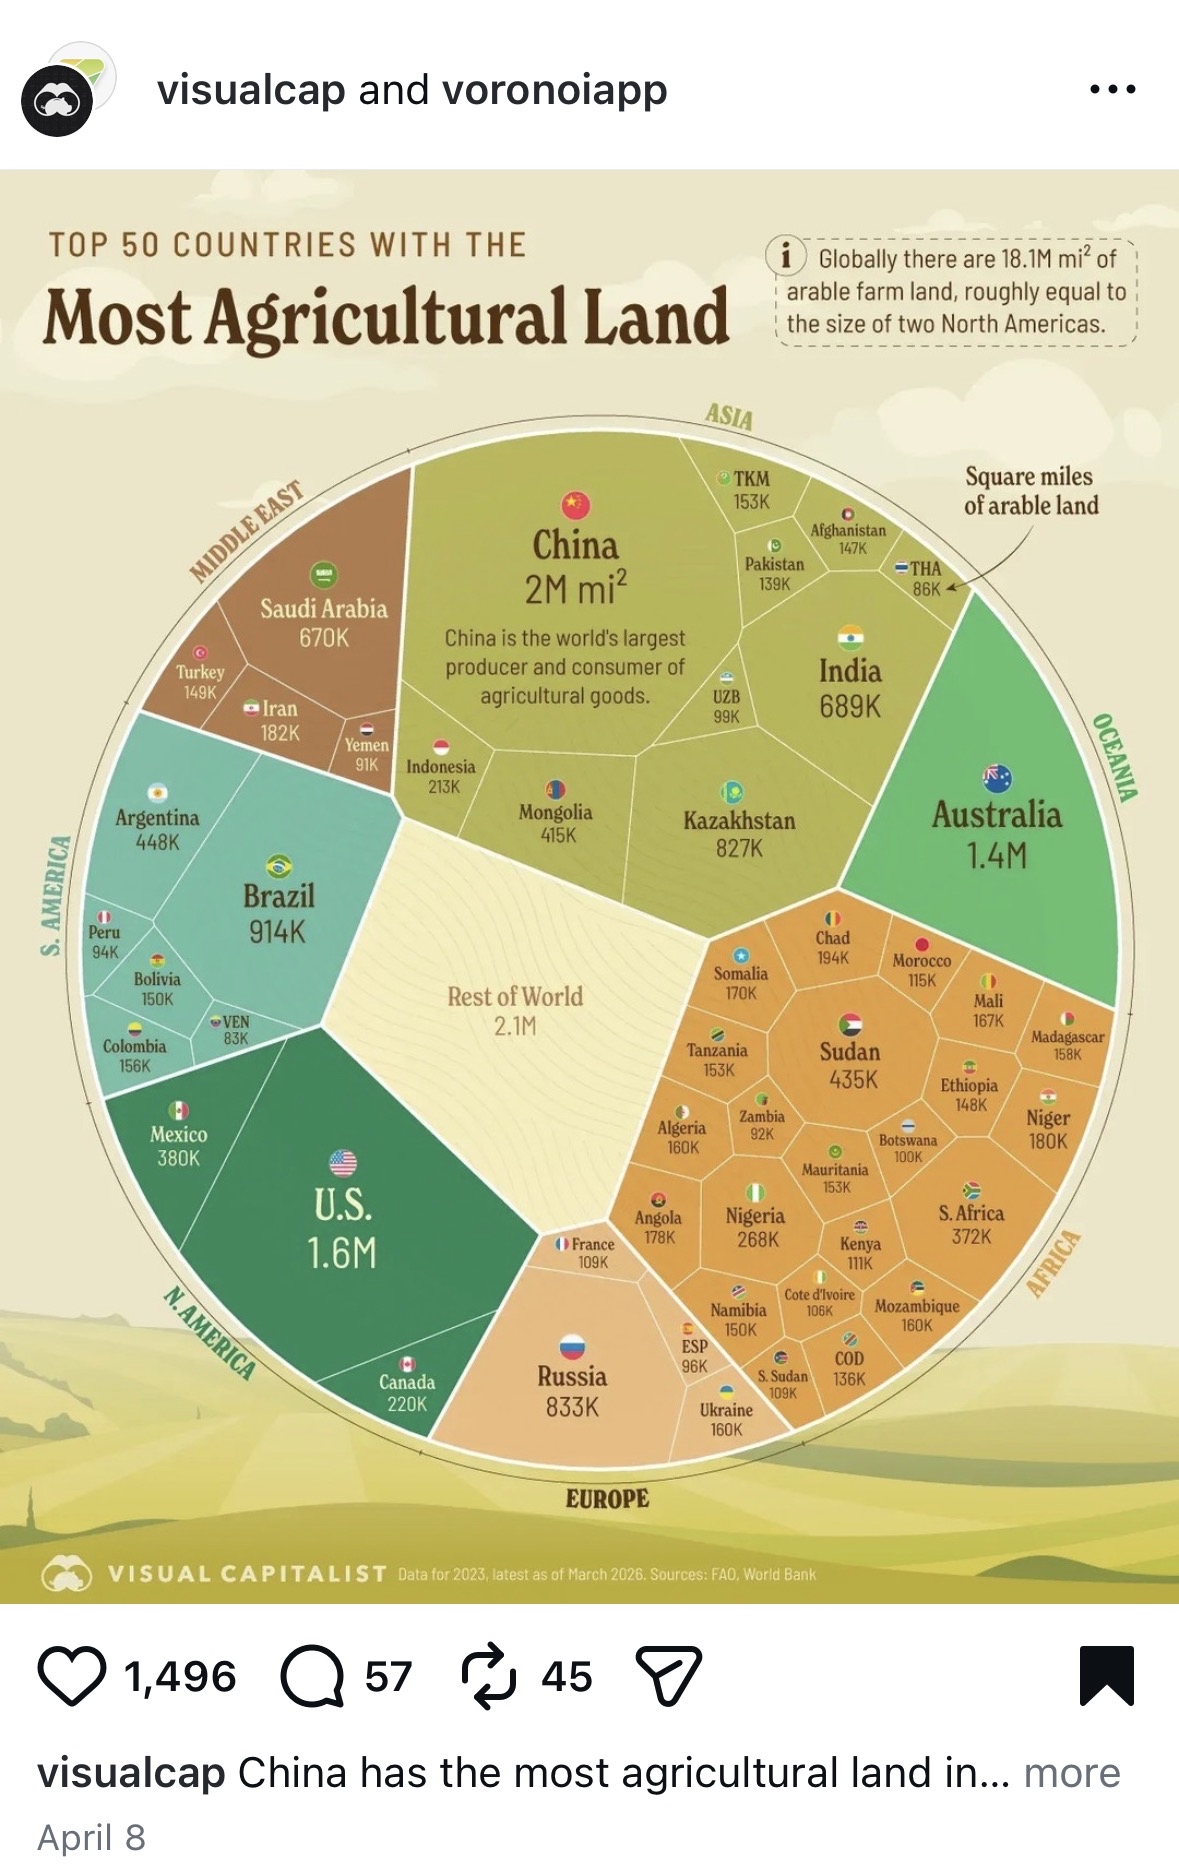
Meta's World, By Headcount
Top 10 metros, drawn as a voronoi treemap sized by Meta headcount. Color = region. Cells with green outlines are growing, red are shrinking — width of the outline scales with the growth rate.
Source: LinkedIn TI · top 10 metros · 2026-05-14
The Monthly Pulse
12 months of real flow into and out of Meta. Hires rise above the line, departures drop below. The yellow ribbon overlay is total headcount — peaked at 71,014 in Oct 2025, fell since.
Source: LinkedIn TI · monthly chart values via Highcharts API · May 2026 is partial-month.
Daily Pulse · A Year in Squares
The 12 months of hires, departures, and net change laid out as a calendar heatmap. Each square is a day, color is intensity. The heavy hiring tail of May–Sep 2025 and the Dec/Mar departure spikes pop right out.
Source: LinkedIn TI monthly totals · daily distribution approximated (real data is monthly).
The Meta Talent Sankey
Last 12 months. Left: who Meta hires from. Right: where Meta's leavers go. Green flows in, red flows out. Watch the OpenAI strand: Meta's biggest single leak.
Net +876 talent in 12mo · source: LinkedIn TI · 2026-05-14
Talent Flows · Four Views, Three Windows
inspired by · linkedinideas.jamesraybould.me/talent-flows ↗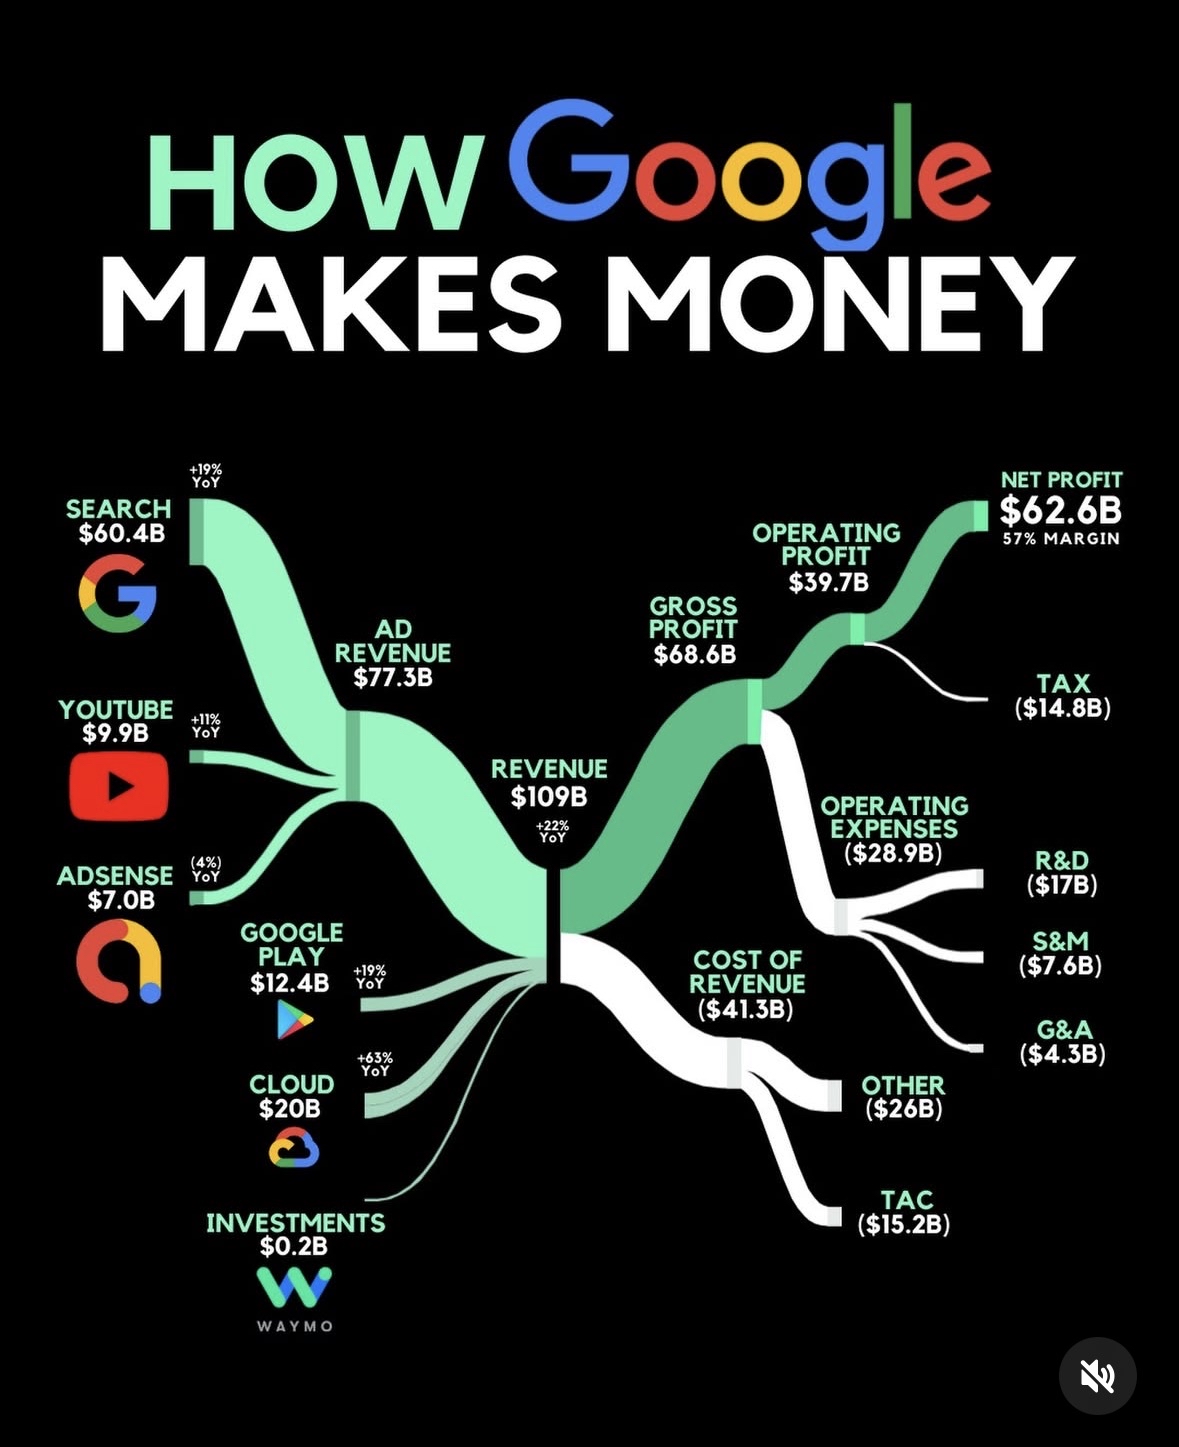
Talent Flows · Four Views, Three Windows
The 24 biggest talent-flow relationships at Meta. Toggle between four visual modes and three time horizons. Watch how Google flips from +513 (24mo) to −69 (6mo) — relationship deteriorating in real time.
Companies orbit Meta. Closer to center = more talent moved. Color = direction.
Source: LinkedIn TI · top 24 flow companies per window · 2026-05-14
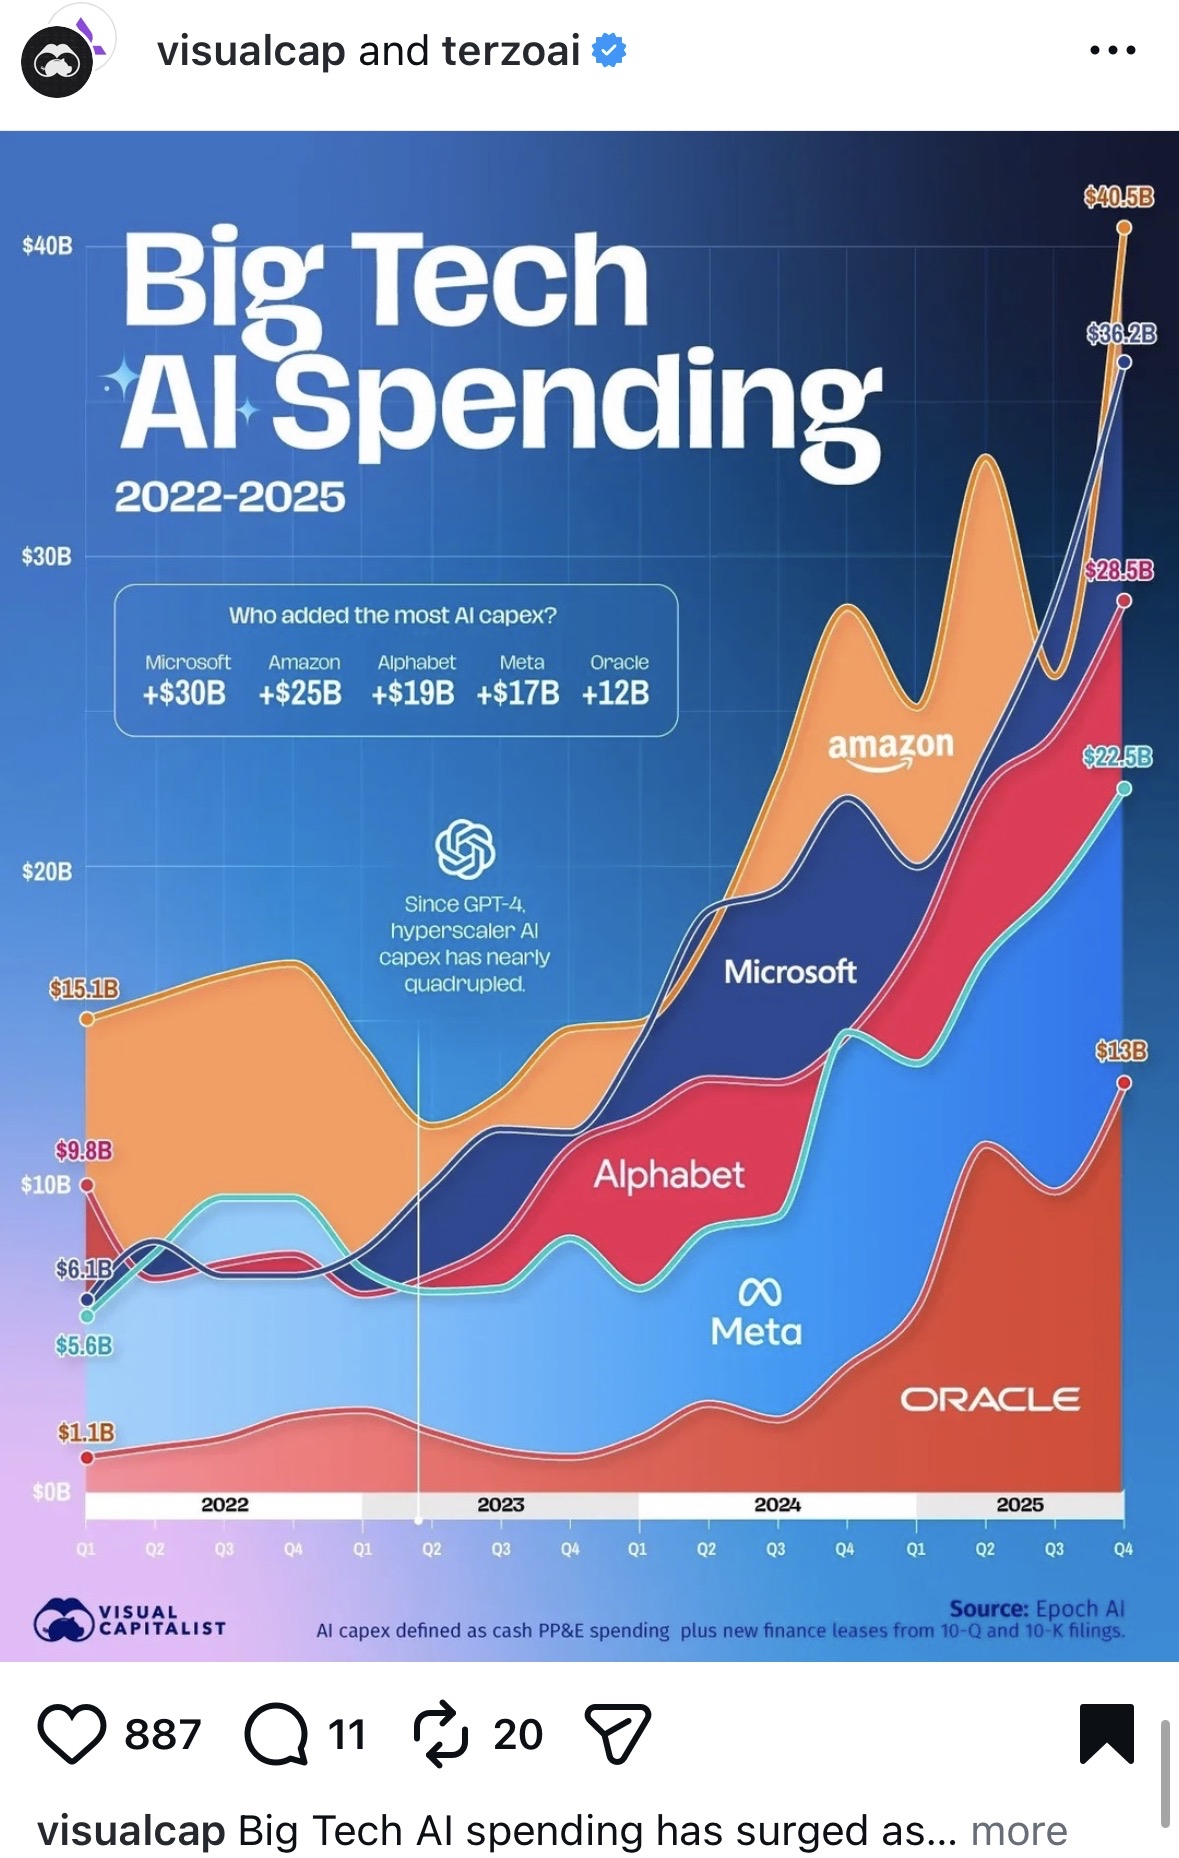
How the Flows Are Trending
Each line is one company. The Y axis is net talent flow with Meta. As we move right, the time window narrows (24mo → 12mo → 6mo). Lines that cross zero are relationships that flipped direction recently. Watch Google fall from a +513 net winner to a −69 net loser over the past 24 months.
Source: LinkedIn TI · 6mo + 12mo + 24mo flow windows · 2026-05-14
Talent Flow Network · Force-directed
Each node is a company that exchanged talent with Meta over the last 12 months. Size = volume of flow. Color: green = Meta net won, red = Meta net lost. Closer to the center = stronger flow. Drag a node to explore.
Source: LinkedIn TI · 12-month flow companies · drag/hover to explore · 2026-05-14
Which Skills Are Rising at Meta?
Same 10 skills, ranked two ways. Left: by headcount today. Right: by 1-year growth rate. Big upward jumps = where the hiring engine is pointed.
Source: LinkedIn TI · 10 skills, two rankings · 2026-05-14
Same Skills, Different Stories
Toggle ranking metric. Watch how the order rearranges itself — Python sits #1 by count, but ML/NumPy rise when you sort by growth.
- 1Python29,085count 29,085growth +9%hires 6,313
- 2Java22,766count 22,766growth +7%hires 4,305
- 3C++20,956count 20,956growth +8%hires 4,141
- 4SQL20,532count 20,532growth +7%hires 4,046
- 5Algorithms17,449count 17,449growth +10%hires 3,827
- 6C16,049count 16,049growth +8%hires 3,104
- 7JavaScript15,930count 15,930growth +7%hires 3,104
- 8Data Analysis14,787count 14,787growth +4%hires 2,942
- 9Machine Learning14,142count 14,142growth +11%hires 3,536
- 10Software Development13,643count 13,643growth +3%hires 2,240
Source: LinkedIn TI · 2026-05-14
Race to Headcount
10 metros, each a sweep around Meta. Sweep length = share of that metro's headcount. Color = 12-month growth.
Source: LinkedIn Talent Insights · 2026-05-14
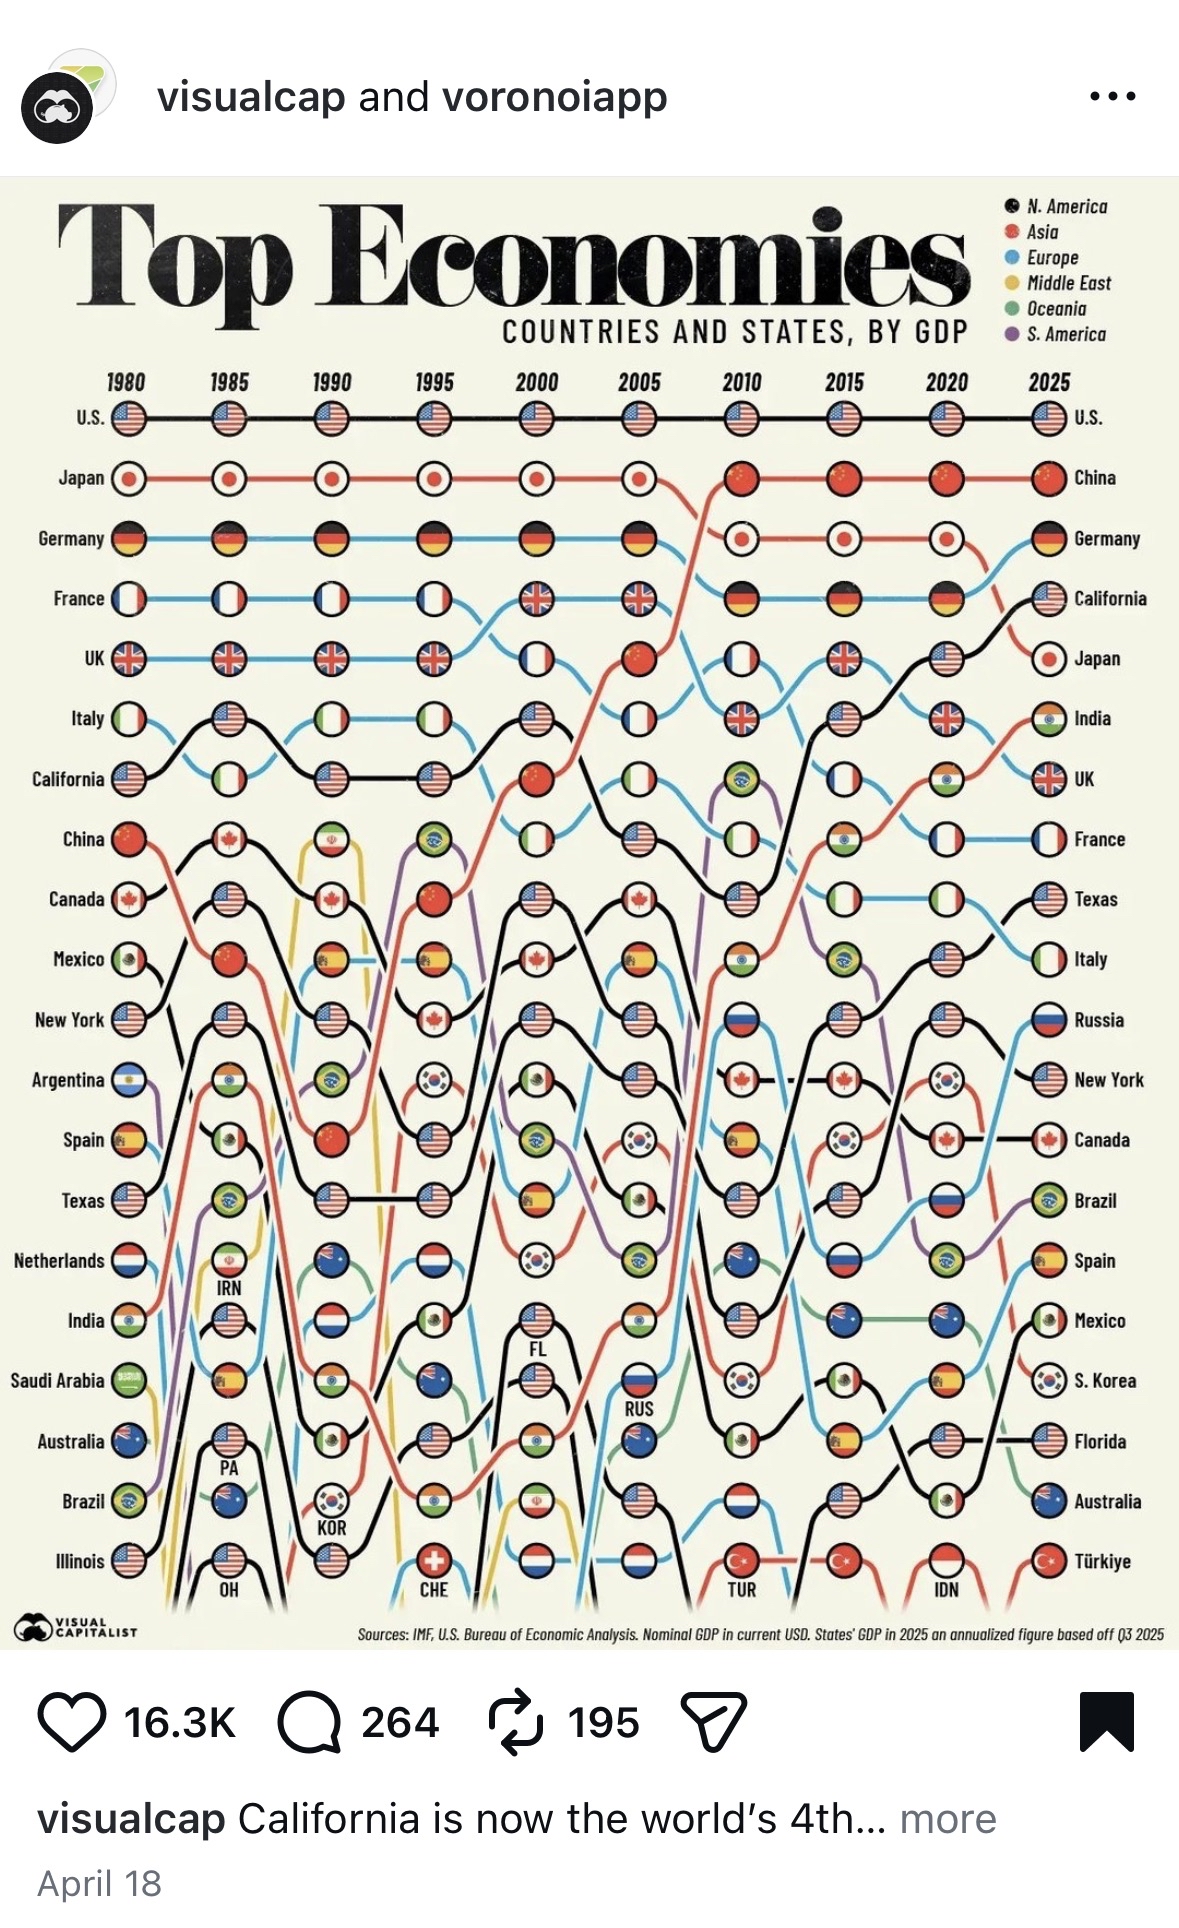
When Each Function Peaked
Every function has a peak month. Sorted by share of headcount lost since peak. HR peaked back in May 2025— the month our window opens — and has fallen ever since. Engineering didn't peak until Feb 2026, riding out 8 of the 12 months of total-company decline.
Source: LinkedIn TI · per-function monthly headcount filtered for each of the top 10 functions · 2026-05-14
The Top 10 Title Trajectories
Same 13-month window for each of Meta's top 10 titles. ML Engineers and Production Engineers are still climbing; most others peaked between Oct 2025 and Feb 2026 and have eased back since.
Source: LinkedIn TI · Job Title filter applied per title · 2026-05-14
Where Meta Actually Bled
Each function's last 12 months: departures on the left, hires on the right. Width = absolute people. Sorted by net change so the biggest bleeders sit at the top. HR lost 651 net (33% of its body) and barely replaced any.
Source: LinkedIn TI · per-function 12-month hires + departures via filter · 2026-05-14
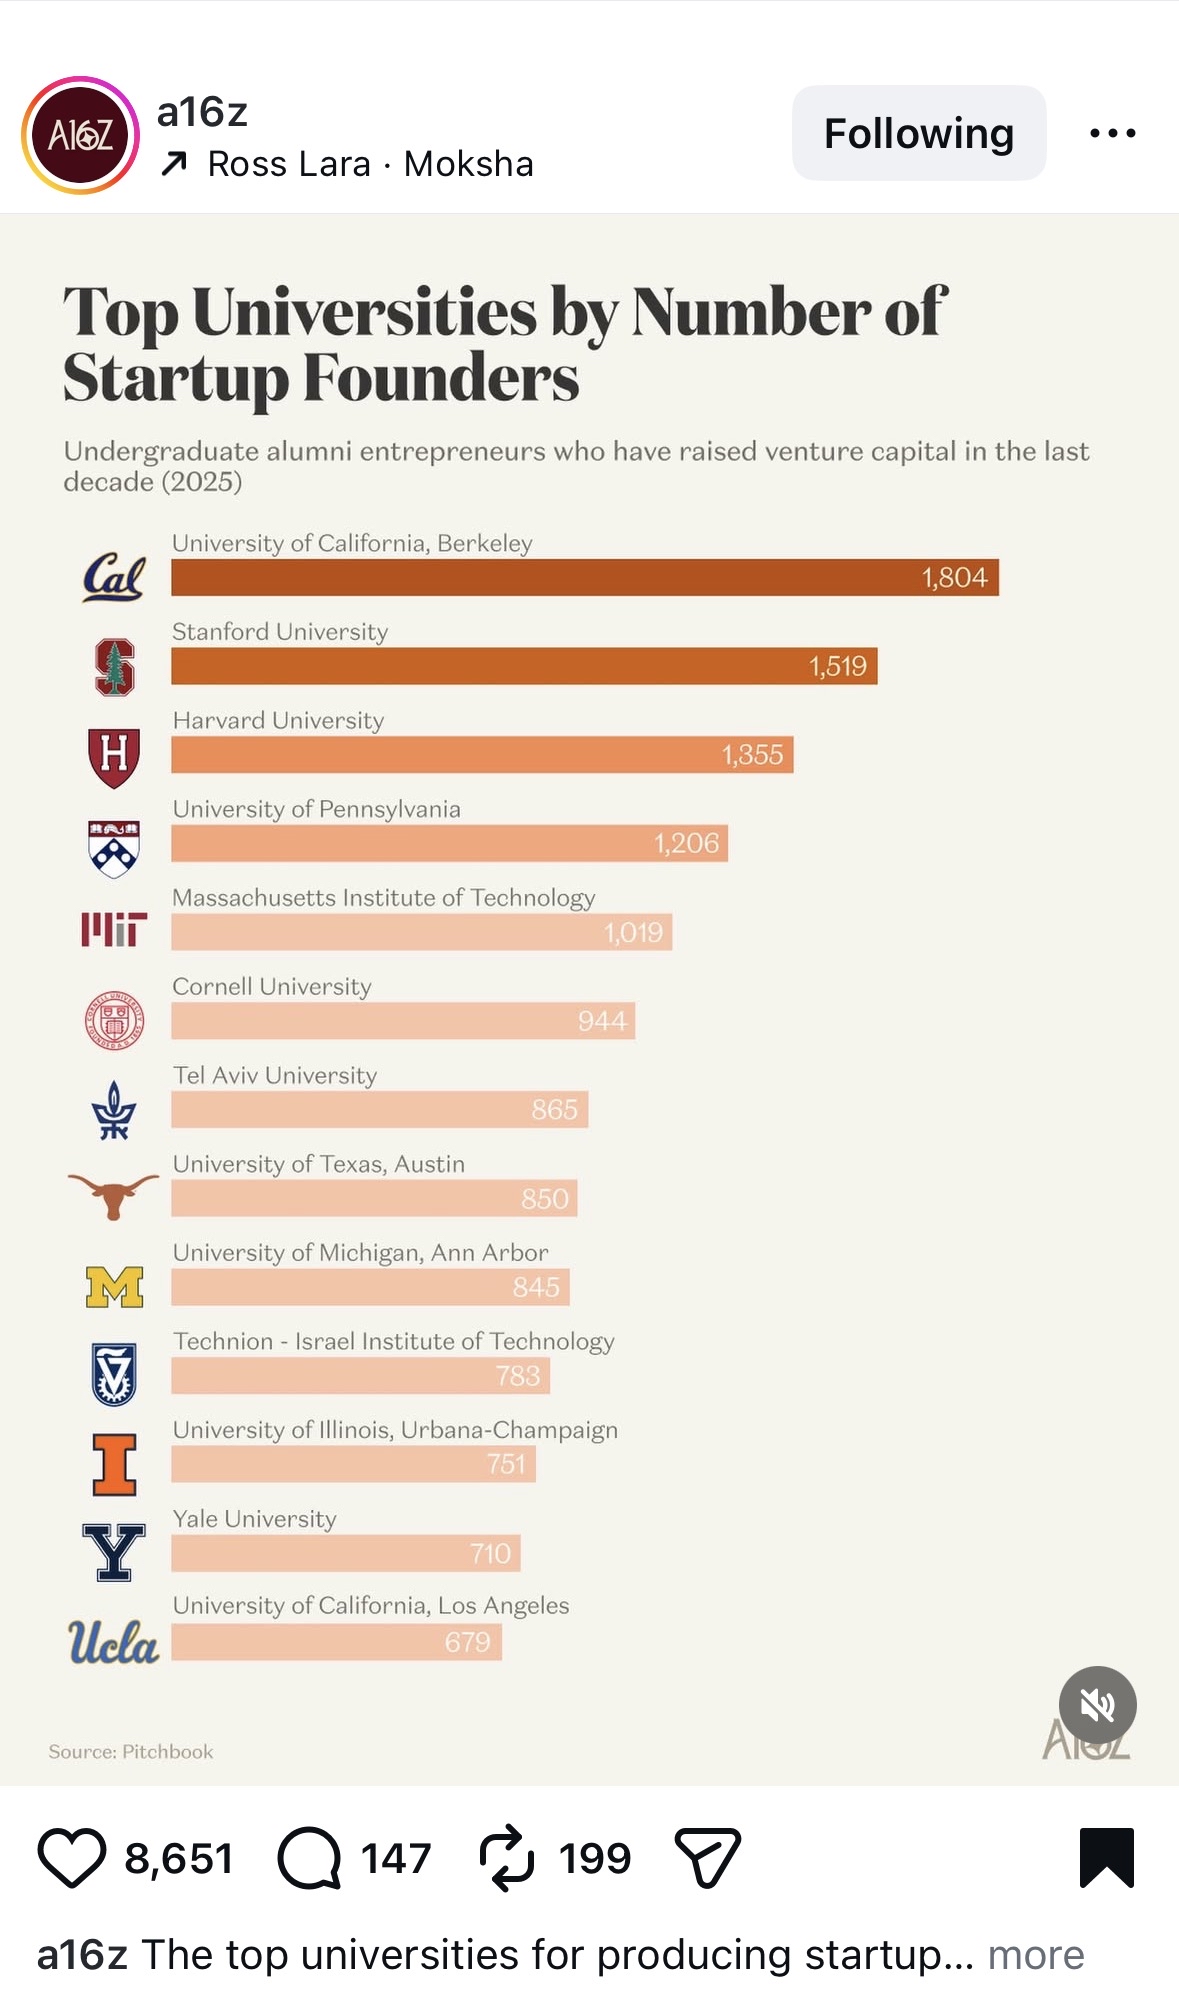
Top Universities by Meta Headcount
Undergraduate alumni working at Meta today, with 1-year growth
- 1University of California, Berkeley
- 2Carnegie Mellon University
- 3Stanford University
- 4Georgia Institute of Technology
- 5University of Washington
- 6University of Southern California
- 7UCLA
- 8University of Illinois Urbana-Champaign
- 9Columbia University
- 10UC San Diego
Source: LinkedIn Talent Insights · scraped 2026-05-14